Thursday, December 10, 2020

An Unusual Image AND Learning Experience

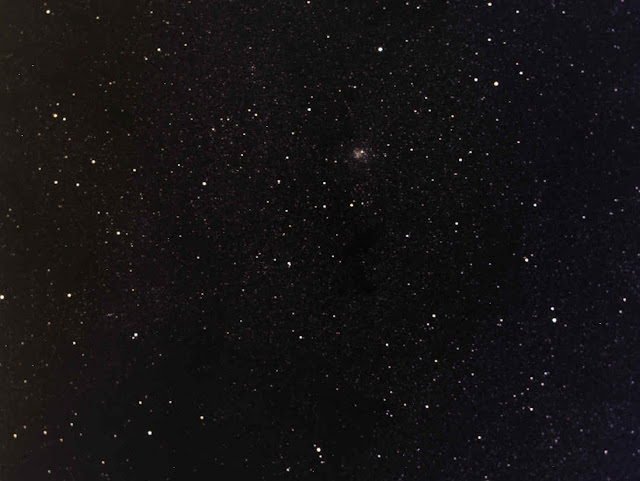
The subject of this image is NGC1893, located in the constellation of Auriga. The NGC object is an open cluster of stars, but has a Hydrogen-alpha region associated with it called, apparently, IC410 and SH 2-236. In my image, the predominant red region is IC410/Sh 2-236. Separating the open cluster from the background stars is more difficult.
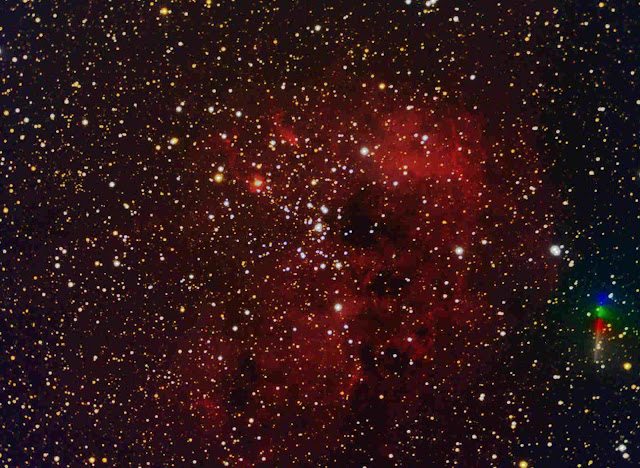

NGC1893. What's that on the right side of the image?

So, what makes this image more interesting than usual? The story begins three nights before when I imaged the same object. However, I imaged at (binning of) 2x2 for the luminance channel, and 4x4 for the red, green, and blue channels. The idea was multiply the RGB channels by 2 to match the L channel, then combine like I usually do. Turns out, that's not possible. The image in 2x2 is 1663 pixels wide, while the 4x4 are 831 pixels wide. And never the twain shall meet. One lousy pixel off, and I had to throw the RGB channels away. Such is life. So, after finding this out, I re-shot the images, (LRG&B) again on the 8th. Turns out, that makes things more interesting. Lesson #1, don't shoot 2x2 and 4x4 and think they can be combined. In my experience, shooting stars with underlying or nearby nebulosity can be problematic; either the stars are over exposed, or it's extremely difficult to bring out the nebulosity. Or both. Bringing out the nebulosity was the case this time. Certainly not APOD quality, but probably as good as I can do under the circumstances. Now things start getting very interesting. Looking at the bottom right corner of the image, there is something that looks like a grey “wand” that changes to red, green, and finally blue. That really is a thing and it took me about a half day to find out what was going on. I figured it might be an asteroid moving across the field of view, since the entire run for shooting this image was about 2 ½ hours. I tried several web sites to try to determine what asteroid it could be, but to no avail. It turns out the at least one of the suggested web sites needed the coordinates of the center of the image to try to figure out what the moving object could be, so I tried my old friend ASTAP. In this case, it was ASTAP to the rescue. ASTAP can also figure out what comet of asteroid is in the image, so I downloaded the needed files and decided to try it. Turns out it wasn't an asteroid, but a comet. The line is comet C/2020M3 Atlas. So, why is it a line? The 1st hour of imaging was done in the L channel, hence the grey line. Then, 20 minutes each of red, green, and blue, which make up the remainder of the multicolored line. There you have it. Mystery solved, and I learned a method of identification of asteroids and comets in an image. (end of lesson #2) Below is the ASTAP plate solved image, showing what I found on ONE of the many L channel images. Notice the circle annotated D0 18. Another mystery and one with little information. As best I can find out, that refers to a Dolidze catalog, entry # 18, which, apparently is a catalog of open clusters (end of lesson #3). Who knew? (Well, I do now.)


ASTAP Plate solved image above.

Saturday, November 28, 2020

Tuning Effects

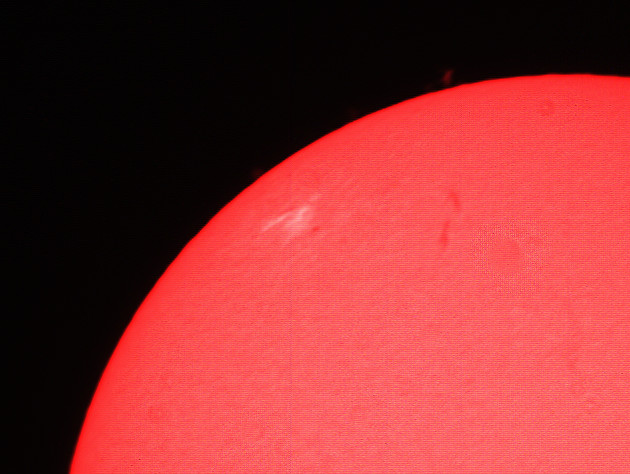
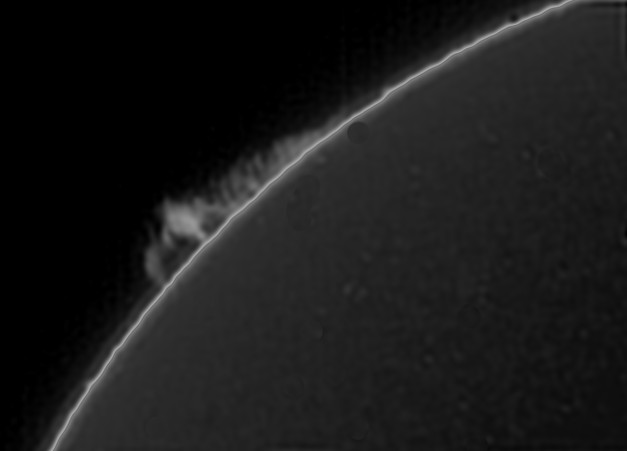
 One of the adjustments on my solar scope (Coronado Solar Max 2, double stack) effects the “tuning” of the scope. Truth is, that is the primary thing that can be adjusted, other than the focus. The object of tuning the scope is to allow the user to obtain more contrast on objects, eg sunspots. The tuning appears to be rather sharp. I often see the effect as the brightness spread across the face of the sun. Today, I took several images of the sun. However, a major difference today is the sun is too low to ride piggyback on the LX200GPS, so it is used as a stationary scope. Of course, that means that the sun drifts across the field of view of the scope. With no tracking (of the sun), stacking becomes more difficult and, generally, the images suffers from “motion blur”to some extent. With that in mind, what I want to show, is the effect of changing the tuning on the scope. As there is no method of measuring the difference in tuning, the best I can do is just show the effect. So, image 1 is with the tuning one way; image 2, another. Note the increased detail, however, in image 2. One of the main things the tuning does is change the center frequency of the light coming through the scope. Elements with doppler shift can disappear if tuned out of the bandpass of the scope. That's basically the effect seen in image 1. The bandpass was changed to favor the right hand side of the image, so elements barely visible in image 1 are now more easily visible in the 2nd image.


Image 1. Note the white, hotter, area around the sunspots and prominence about 5 0'clock.

Image 2. Much more to be seen.


Friday, November 20, 2020

Some Catching Up

 There are several deep sky images taken and processed that I have yet to put on the blog. Today's entry is something that should have been appropriate for Halloween, perhaps. Its NGC7380, the Wizard Nebula, aka Harry Potter and the Golden Snitch. I can't say how it came by either of those names, but I guess that's why I don't name nebulae. NGC 7380 is a young open cluster of stars in constellation of Cepheus, discovered by Caroline Herschel in 1787. The surrounding emission nebulosity is known colloquially as the Wizard Nebula. The nebula is known as S 142 in the 1959 Sharpless catalog. It is extremely difficult to observe visually.


NGC7380 (open cluster of stars) and Wizard Nebula (S 142)


Monday, November 16, 2020

Views of the Mars

Finally, in this series, we have 2 nights of Mars. First from October 21, 2020, which apparently had the less good seeing of the two nights. Image taken at F10 (with the 8” LX200GPS). Then, the second night was November 9, 2020. I took one image at F10, the second at F20 for comparison. The seeing was good enough that I think the F20 image might be the better of the 2.

Mars, October 21, 2020. F10.

Mars, November 9,2020. F10.

Mars, November 9, 2020 F20.


Sunday, November 15, 2020

Views of the Jupiter

 
Continuing …. Jupiter is continuing its westward movement in the evening sky. I my case, that means further towards the roof of the observatory. Problem with that is, the air rising from a somewhat hot roof will distort the air, essentially increasing the seeing, making it worse, of course. The first image is from October 21, the second from November 9, 2020. The blurring effect from the rising air is obvious. The November 9th image is a composite of two images; one taken to get the better image of Jupiter, the other, taken as a longer exposure, to get the moon.

Jupiter October 21, 2020


Jupiter November 9, 2020. Composite. Moon most likely Io.


Friday, November 13, 2020

Views of the Moon

 Continuing posting from images taken since the last major posting, I took images along the terminator of the moon on October 21, 2020. Unless I have a specific target in mind, I “run the terminator”. Afterwards, I look for interesting things; things I haven't seen before. Often the way the light strikes the moon, subtle differences in shading will show different things. This is the case for me on the image below. I see an inverted “Y” is the shading emanating from the crater Cook B. The feature is visible in Virtual Moon Atlas, but is not as prominent in VMA. At any rate, the lower image is the same as the upper one, with the “Y” drawn in.


October 21, 2020. Cook B.


Inverted "Y". See if you see it in the above image.


Thursday, November 12, 2020

Views of the Saturn

 Continuing from yesterday's post, today's post is views of Saturn. I can't say that I see much change over the last month.


From October 7, 2020.


From October 21, 2020.


From November 9, 2020.


Images from Nov 11

Wednesday, November 11, 2020

Views of the Sun

 Over the past several weeks, I imaged several objects when I could. Sometimes it was the sun, or a planet, or star cluster. What I have today is several images of the sun and I'm pretty sure you will know what the prime object in the image is supposed to be; ie sunspot, etc. 


Prom, October 6, 2020.


"Full" sun, November 04, 2020 Sunspot upper left filament at its right, Proms at 4 and 5 O'clock.


Closeup of above sunspot/filament, prom at 11:30.


Friday, October 9, 2020

A Numbers Game

 (Aren't most things?) Anyway, in the previous images of NGC6823, I was wondering just how dim the nebula is. Of course, this would have to be referenced to my location, since local light pollution would affect how dim the nebula appears. Another way of thinking about this is, light pollution makes the black portions of the sky lighter, thus decreasing the contrast between it and the nebula. Lack of contrast would have the effect of making the nebula look dim. (Find a polar bear in a snow storm type of thing.) Since this is a LRGB composite, and the nebula is red, I decided to use the red channel for the determination. So, what did I get? I looked for the darkest portion of the image and found that it had a mean reading of 599 ADU. (ADU means analog-to-digital unit. In my case, since I have a 16 bit camera, 1 ADU represents 1 of 65536 levels of brightness. 0 or zero equals black, 65535 equals white.) The mean reading in the brightest part of the nebula is 749. That's pretty close. In other words, the nebula is only 150 ADU brighter than the blackest part of the sky (in this image). That's not very bright. It turns out that the nebula is only 0.23% brighter than the darkest part of the sky.

Sunday, October 4, 2020

More Of The Same

 In this case I'm referring to NGC6823. A cold front has moved through Georgia, leaving somewhat clearer skies. I wanted to use N.I.N.A to try positioning the scope to the same coordinates as the previous image of NGC3823. However, the updated version was, shall we say, uncooperative. I ended up using Stellarium to move the scope to the region, then plate solved the image I took to be sure I was where I thought I was, and it came back as being very close. I decided to go with that and see how close it actually was when I added two nights worth of data together to see if there was a substantial improvement. (I'll let you decide what you think.) The previous blog entry was 7 minutes (one minute at a time) in each of the four filters, L,R,G, and B. Below is that same data, plus an additional 10 minutes in each of the four filters; so 17 minutes in each filter for a total of 68 minutes total exposure. Post processing was different for each image, but I don't think that was a major factor in the outcome.


NGC6823, two nights worth of data. MUCH larger nebulosity showing.


Sunday, September 27, 2020

Working Through Frustrations

 It seems so long between imaging sessions at the scope that I forget how to image. Part of getting old, I guess. Plus, astronomical (or as I do it, astrocomical) imaging is a complex activity at the best of times. At any rate, I have imaged several objects since the last entry to the blog. And I can't say I'm impressed with the results, with one exception. That one will be obvious, I think. High clouds, high humidity, and light pollution all seem to conspire against astronomers trying to bring the beauty of the night sky to a computer near you. (Will it every change? Sigh.) Here is seen some of the latest trials and tribulations.


NGC 6401, the "fuzzy spot" to upper right of center.

Above is the globular cluster NGC6401. This is actually a color picture, it just doesn't seem so. If it shows up in the blog image, there is also a large “X” looking feature in about the center of the image. That is dust in front of the stars, blocking out the starlight. It's known as Barnard 82. The Barnard Catalog is a list of “dark nebulae” (basically areas of the sky where no light is coming through from the light source located behind it, whether that source is stars or a emission/reflection nebula) and was compiled and published in 1919 by Edward E. Barnard. A lot of the catalog can be found along the plane of the Milky Way, as in this case.


NGC 6823 et al.

Above is and image of several things, one of which I haven't been able to identify yet. NGC6823 is the open cluster in the center of the picture. As far as I can tell, it's the brightest stars in the picture. I suspect several of the dimmer stars are included, but I have no idea which ones. NGC6820 is a small reflection nebula nearby. Reflection nebula are usually bluish in color. I can't say that I see anything like that in this image. The redish area is an emission nebula, which I think will be Sh 2-86. The “Sh” designation refers to an entry in the Sharpless catalog of emission nebula. The color image is composed of about 7 one minute exposures in each filter (LRGB), and I'm really not pleased with the result. However, the black and white image is the same image devoid of color. It would be (almost) the equivalent of 28 one minute exposures. I think it shows more detail. The take home message from this is that I suspect I will go back to this object and try to get more data by taking about 21 more images in each color and restacking them. Hopefully, this will make the color image at least as good as the b/w image. We'll see. If you look at the bottom edge, about ¼ the way towards the center you can see something that looks like a small comet. I haven't been able to identify this as yet. It could be part of the emission nebula that is “thicker” in that area, or it could be a comet or one of several other things. Currently, I'm betting on it being part of the nebula.


Caldwell 19

Finally, the above image is that of Caldwell 19. This one actually turned out pretty good, I thought. This one is also in the plane of the Milky Way, but much further North, closer to the star Deneb in The Swan.

Wednesday, September 9, 2020


Jupiter and Saturn


On the night of September 7,2020, we still had the persistent high cloudiness, but otherwise had almost decent skies. It appears this will be the last time for at least a week, but I took advantage of the opportunity to photograph Jupiter and Saturn. Although, in full resolution I can easily see the image degradation, they are otherwise not too bad. Actually, probably fairly decent for the conditions. Picture of Jupiter also has the moon Europa at the far left, almost at the edge.


Europa and unnamed star to far left of image

Tuesday, September 8, 2020


Three Day Prom


(as vs. a 3 dog night? Sorry.)

We have had unusually clear(ish) skies for the past 3 days. A cold front moved through and lowered temperatures and humidity to more bearable levels, but alas, that's about to change. So today, I got out before the clouds started to return and took one image of the sun. And, it was a blank sun. However, just because something is not immediately visible doesn't mean it's not there (as hopefully we will see later this week). At any rate, what I decided to show this entry was a prominence over the past 3 days. All images were taken at approximately the same time of day, but the second day entry was taken with a longer exposure because it was looking like the prominence was becoming sufficiently dim that the longer exposure was needed. However, today's (the 3rd entry) was taken with no expectation of seeing the prominence. However, with an extreme “stretch” the remnants are visible. Well, you've waited long enough, so here the images are from day 1 (September 6, 2020) until today (September 8, 2020). 


Day 1


Day 2


Day 3. Image part of a full sun image.


Sunday, August 23, 2020

Calculations and Explanations

 This thread started when, on the night of August 18, I finally got a chance to do some imaging. That night, the targets were going to be Jupiter and Saturn. With my setup, those are relatively quick targets; no flats and darks, if any, taken at the same time as the lights. The results were....amazingly poor. I usually blame results this bad on the seeing, atmospheric turbulence. In this case, I'm sure that was the major player. But, as I understand more about the telescope and camera, I can see that its not just that (even if, as we will see, it appears to be the major player). First, though, the “final” images.


Jupiter


Saturn


 So, what can I learn from this.

  1. First thing is to find out what the scope is capable of. This is often reflected (no pun intended, but not bad anyway) in the Dawe's limit. This is a calculation that puts a number on the resolving limit of a telescope. Resolution is the ability of the scope to “resolve” to objects that are next to each other into the two separate objects. In other words, how close together can, say, two stars be and I'm able to tell they are two stars, not just one fat one. For an 8 inch SCT, which is what I have, that limit is 0.57 arc-seconds. Anything closer together than that can't be separated.

  2. Camera “resolution”. This is something I've known and worked with for a long time and I (mostly) understand the factors involved. For the images above, the relevant information is scope... 8”, F10, and camera... 3.75micron pixels,1290x960 chip. This calculates to a resolution of 0.38 arc-seconds per pixel.

  3. If the image seems blurry, it is not because the image is smeared over too many pixels, since the camera can “see” better than the scope can deliver (0.57 scope vs 0.38 camera), it must be something else like focus or seeing.


What can I do to improve my planetary images.

  1. Move to an area of the country with better skies, ie, less water vapor (clearer), and better seeing. Not likely to happen in my lifetime.

  2. Get a faster camera. The air turbulence causes motion blur. A faster frame rate has the possibility of “stopping” the motion to get clearer frames. This is possible, especially since the company that makes my camera has several versions that are faster, with faster download speeds (which is usually the bottleneck).

  3. Get a bigger telescope, say a 14 inch SCT. This would allow the Dawe's limit to be the limiting factor in resolution. Really not likely to happen in my lifetime.

Wednesday, August 5, 2020

The Sun Starts a New Solar Cycle

This morning, while there were few obscuring clouds but still have the persistent high cloudiness, I decided to try imaging the sun again. This time there were only a few, small prominences, but there was signs of activity on the disk. I think this is part of the (new) solar cycle 25 coming to life. There were at least 2 filaments as well as other activity. The darker regions are places where the surface is cooler the, the white areas are generally where the surface is hotter. Even in hydrogen alpha light, sunspots are generally cooler and show up dark. The white regions are, if I recall correctly, called plague. The (falsely colored) yellow picture is the larger filament, while the full disk images are the same, except the black/white image is a stack of 3750 (out of 5000) frames taken is black and white, and the red image is 2250 frames (out of 3000) taken in color. The red color is the color of hydrogen alpha and, at least on my computer, is pretty close to what you would see if you were looking through an eyepiece at the sun.


"Close up"of the larger filament.

Color version, same as below.

Black and white version. Notice filaments below white areas and to the upper left.


Thursday, July 23, 2020

Today's Sun

This has been an unusual year; first the pandemic, then more clouds than I have seen, constantly, in decades. I know I've mentioned it before, but it has been difficult to get any images of the sun or anything at night. This morning, with no clouds, I went for the sun, and got something, at least. As shown in the image below, which was taken in hydrogen alpha light (around 652 nm, if I recall correctly), we can see one sunspot, AR2767, which is a member of the NEW solar cycle, cycle 25. Also visible are a few prominences on the East side of the sun. This is a stack of the best 2500 of 5000 frames taken to make the image.

Sun morning of July 23, 2020

Saturday, July 11, 2020

Some Dews and Dont's

Last night was another first for me, and this entry is to serve as a reminder of what NOT to do. Yesterday afternoon, we had a brief thunderstorm. Short, but some heavy rain for a few minutes; typical. The sky generally cleared up afterwards, so I decided to try an imaging session. OK, all set up. Time to run the flats for the night, and...
Bullseye!

That's what I got. What should it have looked like, you ask? (Thank you for asking.)


Normal Flat image


I'm not the brightest bulb in the box, but even I can tell something is not right.
After checking everything in the optical train I could think of, and finding nothing amiss, I was left with only the camera itself. I'm loath to remove it, once attached to the scope, just because it changes what the flats correct in the image; ie, a flat is useful for removing “dust donuts” from an image, but only if the camera is in the same orientation for both the flat and image. Removing the camera means wasting time re-shooting flats. But, detach it I did. And, if you paid attention to the title of this entry, you already know what I found...condensation in the camera.
I've been running the camera this morning to see if I can replicate the issue. After half an hour, no condensation. My worry was that the desiccant needed replacing, which is possible, but a pain. According to the instructions, it could need replacing after 3 years; I'm currently at 5 years with out a (known) need for replacement. So, I'm guessing the moral to this story is, don't try imaging after a thunderstorm when the humidity is still 100%. (So how do they do it in Florida?)

Friday, July 10, 2020

The Sun Again

It's hard to believe that the skies have been as cloudy as they have been for so long. But... I guess we do the best with what we are given. In this case, there was an almost clear day for viewing the sun. I shot about 5 hours of a prominence. You never know if it is moving until you process the images later, and in this case, it seems to have been active. Although I recorded images every 2 minutes, the activity was sufficiently slow that processing every tenth image, ie, every 20 minutes real time, is sufficient to show the activity. It's taken me this long to post this just because I actually processed every image, then checked for activity and found that every tenth image was sufficient to show what I wanted to show. It takes a while to process over 130 images, then put them in a format to make into a video. Oh well, finished at last, anyway. Images taken on July 2, 2020.


Friday, June 19, 2020

Computer test

Your computer, that is.
This morning, June 19, 2020, I imaged the sun.

Prominence on western edge of sun this morning.


What you are seeing is a prominence on the western edge of the sun. (I think it is the northwest, but I get easily confused with my solar scope.) At any rate, this prominence is sufficiently well positioned to make me believe this is the area above sunspot AR2765, which is the sunspot imaged below (on the 13th, the day I actually imaged it. I published the photo later, after processing.). Well, I decided to see if I could merge the two images to see how well they lined up.

Composite of 6/19 and  6/13.
What do you think? The image from today is black and white, and might be difficult to see as the separate image that it is pasted on top of the color image from the 13th. Hence, the test of you computer to see if you see both the sunspot and the prominence. Personally, I think the prominence is from the sunspot. In other words, if we could have seen the sunspot from the side, like we can today, it would have looked much like the prominence image of today.

Tuesday, June 16, 2020

Play Time

I've decided on another imaging “campaign,” this time being the objects in the Caldwell catalog that are visible from my northern latitude. As with most catalogs, there is much crossover between them. The Caldwell catalog consists of 109 objects. I have filtered out objects below -39 degrees declination (can't see them) and of the objects left (I had already imaged some NGCs while doing the Herschel list), I have already imaged all but 25; at least at the start of this endeavor I needed 25. Since the start, I have imaged 3 more. One of those images proved to be a little more interesting than the others, for a reason that I hope will become obvious. It's C35.

C35. OK, the galaxy is just to the LEFT of center.


Although the target is a galaxy in the middle of the picture, which is actually hard to spot because it's an elliptical and looks very star-like, the target is not what's interesting. It's everything else.


C35 with some other objects identified.


The program ASTAP has supplied the information in this image, and the next one, showing what's identifiable in the image. That's quite a lot! But wait, there's more!!

OK, that A LOT!


Asking ASTAP to annotate “deeper” showed this! There's so much there, I can't really see exactly how much I've managed to actually capture, but I think it's a lot.

Moving on. While starting this venture, I missed one target, C61, and had to come back to it the next night. Neither night was exactly clear, but both were fair. At any rate, instead of C61 the first night, I went to the open cluster that looks like a globular, M4.

M4


Not too bad, considering the amount of clouds around.

Finally, I experimented with some Barlow lenses to see their effect. The target was the sun. Seeing is always a big problem for imaging the sun, but I wanted to know if better resolution is really visible with that scope. Well, you can decide for yourself; here are images of a sunspot and a few prominences, false colored, of course.

One of the first sunspots of the new cycle 25. 2x Barlow used

And a prominence  below the sunspot. 2x Barlow.
Same sunspot as above. 3x Barlow.


Tuesday, June 2, 2020

Following a Prominence

For the last 3 days, I have been following a prominence on the eastern limb of the sun. I think 2 things are happening; the prominence is changing and it is rotating into view. I know of no easy to tell which is having the greater impact on what we see. I'm hoping it will present on the surface of the sun in a few days. Unless something terribly wrong occurs, it will be cloudy and I will miss it's appearance. You can follow the last 3 days below; dates under the picture. The last image is just for any astrophotographers that might be reading. AutoStakkert 3 produces and unusual artifact, circled. I can't find any evidence that it appears in the original data and have no explanation for how it got there. Ideas anyone? All images except last one are composite of surface and prominence.

May 31, 2020

June 1, 2020

June 2, 2020

Weird artifact produced by AutoStakkert on June 2 data.

Sunday, May 31, 2020

And a Last

On the night of May 30, 2020 I finished imaging the Herschel 400 list by getting an image of the somewhat unimpressive galaxy NGC 2787. Unfortunately, the sky had a fair amount of high cloudiness, which appears to be a permanent condition, as well as a just past first quarter moon. Nevertheless. I was able to pull out the image from the muk, at least enough to definitely say I got it. I used both my traditional method of confirming the target, which is a comparison to star charts, and using ASTAP to confirm the target by plate solving. By completing this project, I now have at least 500, possibly up to 600 galaxies, star cluster, and nebulas imaged. Not too bad for an old man with limited talent and equipment. At least, I think so.

Friday, May 29, 2020

A Particularly Good Link

While looking around the internet I found what I think is a particularly good, readable paper about solar flares, solar radiation and it's effect on radio communications, including GPS. Since I have photographed a solar flare, see below May 13th entry in particular, I thought an explanation would be interesting. I certainly found it so. I hope you enjoy.

Wednesday, May 27, 2020

A First

I have been trying to image M61 as often as possible since I found out there was a supernova in it. The reason: I want to see if I can follow it (the supernova) long enough to see the fading on the supernova. In and of itself, this would be a first. However, the first I'm actually referring to in this case is the use of the program ASTAP. This program plate solves the image, meaning it finds where in space you had the telescope pointed and what you have imaged. In this case, I'm using it to positively identify M61, but more importantly, I'm using it's photometry function to determine the brightness of the supernova. Brightness is measured in magnitudes in astronomy. I have had only 2 “clear” nights to image M61, so I have only 2 data points. The first image is below (May 12th entry, image taken on the 1th), where I show the supernova. The supernova on that May 11th image measured magnitude 14.5, approximately. As of May 23, it was “down” to magnitude 14.7, approximately. In stellar magnitudes, the larger the number, the dimmer the object, in this case an exploded star. Two tenths of a magnitude doesn't really show in an image, especially one that has been downsampled for the internet, so, I won't show the most recent image. At least I don't think I will now. If I get very few images (and since we're getting rain or clouds a week at a time, that might be what happens), I might come back to show this one. Let's see what the weather does.

Wednesday, May 13, 2020

Solar Flare

NOTE:  To see the video version of this, see the April 29th entry below. This is a more expanded version.

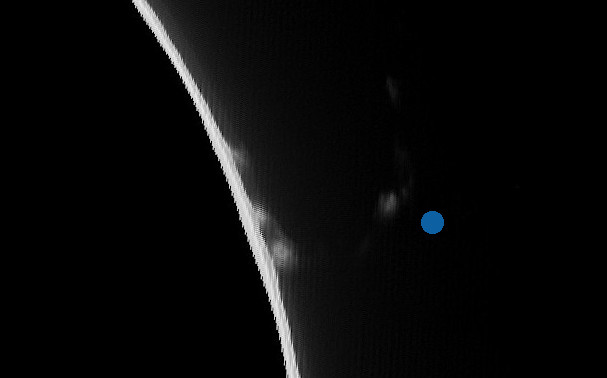
On the morning of April 16, 2020, I decided to take a quick glance at the sun to see if anything was happening. Glad I did. Most of the time, I set the solar scope on a tripod to see if anything is interesting enough to open the observatory and mount the solar scope on the LX200GPS to track the sun and allow better imaging (than trying to image from the tripod). This morning, there appeared to be a large prominence at the edge of the sun, so I thought I would try to image it. It was definitely different from what I usually see, so it had already piqued my interest. What unfolded over the next hour was a solar flare, the first one that I can say with assurance that I've seen. Especially when I was presenting in the national parks, the primary difference I would use to distinguish between a prominence and a flare it that a flare would last minutes, a prominence could last for days, or longer. I imaged from about 9:45 until a little after 11:00 AM (of course) and images were taken approximately 1 minute apart. What follows is a few of those images, with time stamps in the caption to show how quickly this all happened. Comments under the picture.

9:53 Pay close attention to the lower part (closest to sun) of the eruption, but follow the whole thing.

The flare started before I started imaging. Of course, I didn't know about it until I first looked. This is the first good image I could get.


10:05 Notice how the "spout" has become a series of "balls" of plasma.
About 12 minutes later and the flare has started to form balls of plasma and "throw" them away from the surface of the sun. Using images around this time frame, I was able to determine an approximate speed for the ejection of material.


10:14 The blue ball is the size of the earth. This allows a scale comparison.
About 10 minutes later and the largest ball has moved further from the sun. Using the earth as a yard stick (of about 8000 miles), the ball has moved about 4  earth diameters along the curved path of the flare, That would be about 32,000 miles in 9 minutes, 20 seconds according to the time stamps on the images. That puts the speed of ejection around 200,000 MPH. I'm gonna have to say that's the fastest thing I've ever seen.


10:20 Ball has "exploded".
Six minutes later, the earth sized ball has "exploded" or dissipated, leaving behind at least 2 remnants.


10:33 All gone! Well, mostly.
Another 13 minutes and the flare is no more. However, what's left of the sun, looking like waves on the ocean, continue "sloshing" around for another 20 minutes.